Shell stresses
The Shell stresses analysis result shows stresses in shell elements under the current loading or analysis conditions.
It allows you to evaluate stress distributions in plates and walls resulting from membrane forces and bending effects.
Shell stresses are available for several static analysis contexts.
- Load cases – stresses from individual load cases
- Moving load maximum – envelope of maximum stresses due to moving loads
- Moving load influence line / surface – influence results for shell stresses
- Construction stages – stresses during staged construction
- Load combinations – stresses from defined load combinations
- Maximum of load combinations – envelope of stresses from multiple combinations
- Maximum of load groups – envelope of stresses grouped by load groups
Result selection
Depending on the selected analysis context, additional selections are required to display Shell stresses. One or more of the following parameters may need to be selected from the result lists:
- load case type, such as ultimate or quasi-permanent
- load case or load combination
- stress component, for example principal stress or directional stress
- moving load, for moving load–based results
- simultaneous value, for selected maximum-type results
- construction stage
Only the selections relevant to the active analysis type are shown.
The Simultaneous selection is available for some maximum-type results, such as Maximum of load combinations.
First, select the stress component for which the extreme value is evaluated, for example σ x', top+. Then select a Simultaneous component, for example τ x'z'. The result will display the values for τ x'z' component that correspond to the load combination which generated max σ x', top+.
This allows you to study the combined effect of stresses occurring at the same critical positions.
You can see the result for the minimum/maximum stress component itself if you select the Simultaneous value to be the same as the stress component.
For example, select the stress component σ x', top+ and then select a Simultaneous component σ x', top. The result will display the result for maximum normal stress component values in the shell.
Result display
Shell stresses can be displayed using several result display types, depending on the selected result and analysis context:
- Graph – stresses shown as diagrams along shell sections
- Contour lines – stresses displayed as isolines of equal value
- Colour palette – stresses visualised as coloured fields over shell surfaces
- Sections – stresses evaluated and displayed along user-defined section lines
Some result types may allow only a subset of these visualisation methods.
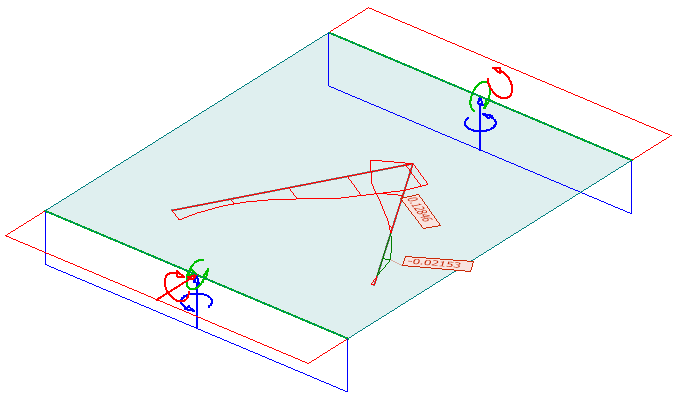
Graph
Stress shown as graph on shells.
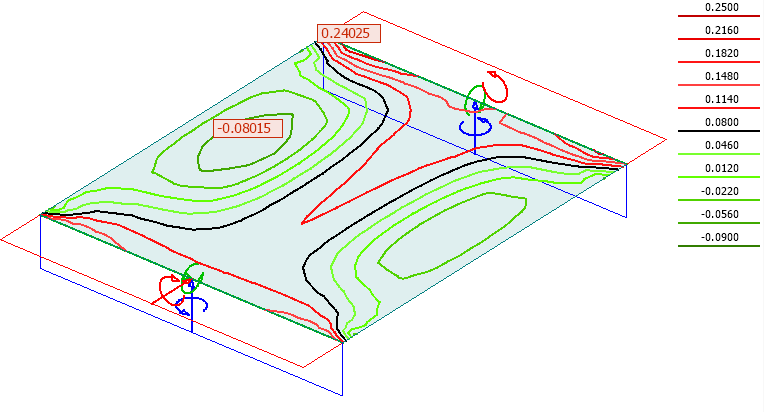
Contour lines
Stress shown as coloured contour lines.
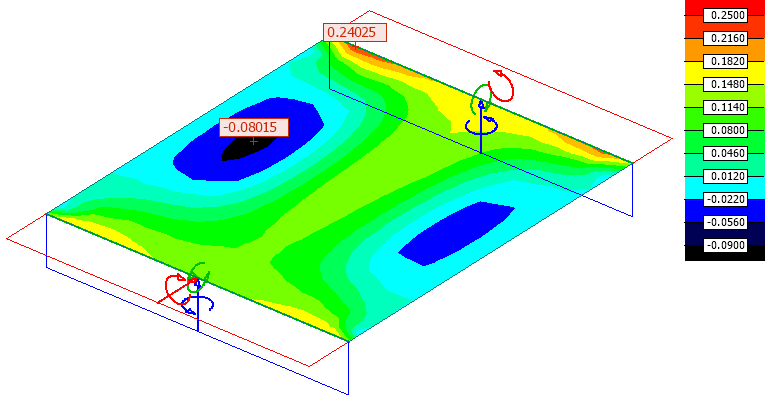
Colour palette
Stress visualised as coloured fields.
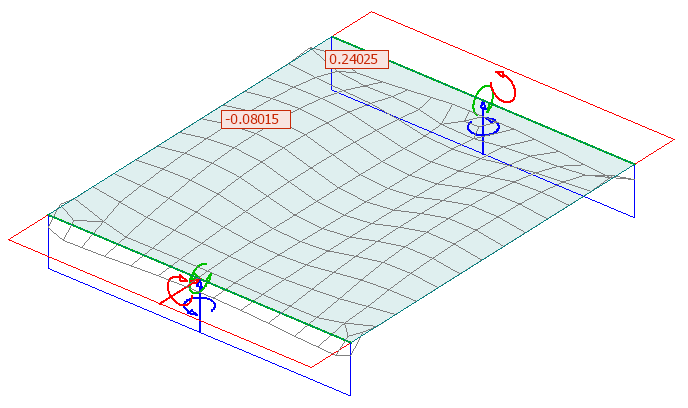
Sections
Stress visualised as sections on shells.